/documentations/python_libraries/matplotlib/
Text
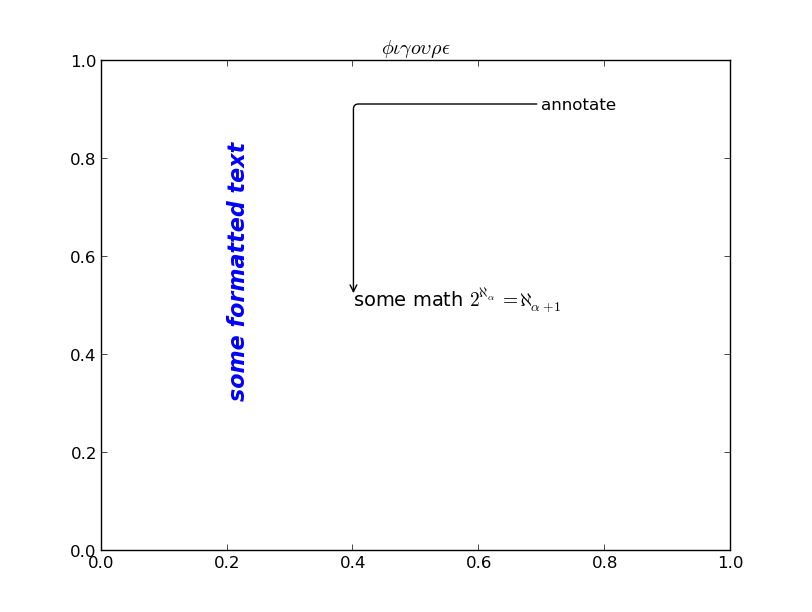
Matplotlib has good text support and gives control over the various text parameters, such as font or style and color or orientation. Interesting here is also the support of TeX in all the text areas. Strings containing TeX markup need to be raw strings (e.g. r'$\alpha$').
# (Image above)
import matplotlib.pyplot as plt
plt.title( r'$\phi \iota \gamma o \upsilon \rho \epsilon$')
plt.text(.4,.5, r'some math $2^{\aleph_\alpha} = \aleph_{\alpha+1}$',\
         fontsize=14)
plt.text(.2,.8, 'some formatted text',\
         fontsize=16, fontweight='bold', style='italic',\
         color='blue', rotation='vertical')
plt.annotate('annotate', xy=(.4, .52), xytext=(.7, .9),\
             arrowprops=dict(arrowstyle='->',\
             connectionstyle='angle,angleA=180,angleB=-90,rad=5'))
plt.show()
More information at: