/documentations/python_libraries/matplotlib/
Components
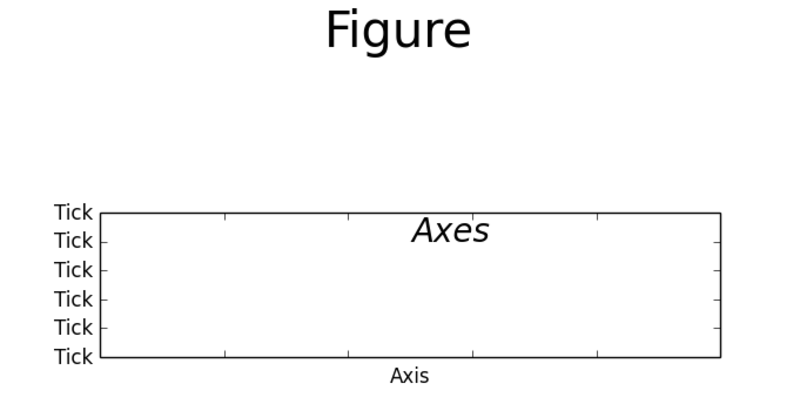
The image above shows the main components used to construct a figure. It is good to know about this components to better understand how Matplotlib works and to be able to customize the result.
- Figure: main container
- instantiated with:
pyplot.figure()
- instantiated with:
- Axes: plotting area
- instantiated with:
pyplot.subplot()
- instantiated with:
- Axis: x- and y-axis of a Axes plotting area
- Ticks: markers on the Axis
More information at: