Plotting with Pyplot
The module matplotlib.pyplot (docs) provides functions to add lines, text, images, histograms and more to a plotting area. This is the set of functions used most of the time. We look at pyplot.plot and shortly at pyplot.text. The full list can be found at the pyplot summary. Some examples are:
arrow: add an arrow to the Axesaxes: add an Axes to the figureaxhline,axhspan: add a horizontal line/rectangle across the axisfigure: creates a new figurefill: plot filled polygonsgrid: turn the Axes grids on or offhist: plot a histogramimshow: display an image on the Axeslegend: place a legend on the current Axesplot: plot lines and/or markers to the Axestable: add a table to the current Axestext: add text to the Axestitle: et a title of the current Axes
More information at:
The plot Command
The function pyplot.plot (docs) plots line segments connecting points given as parameter. Matplotlib works internally with numpy arrays, which should be used in case of big arrays. The function accepts a multitude of parameters. If x and y are one dimensional arrays of the same length and m is a two dimensional array having as many rows as x has entries, then some examples are:
plot(x)will plot the line segments connecting the points(i, x[i])plot(x, y)will plot the line segments connecting the points(x[i], y[i])plot(x, m)will plot a line for each column where the j-th line is given by the segments connecting the points(x[i], m[i][j])plot(x0 , y0, x1, y1)withlen(x0) == len(y0) and len(x1) == len(y1), will plot two lines as expected
Additionally plot accepts formatting strings and a list of line properties:
plot(x, y, 'bo--')will plot a blue (b) dashed line (--), with the points(x[i], y[i])marked by circles (o)plot(x, y, color='green', label='green line', linewidth=2)will plot a green line of width two. The label will be used if a legend is displayed by a subsequent call oflegend().
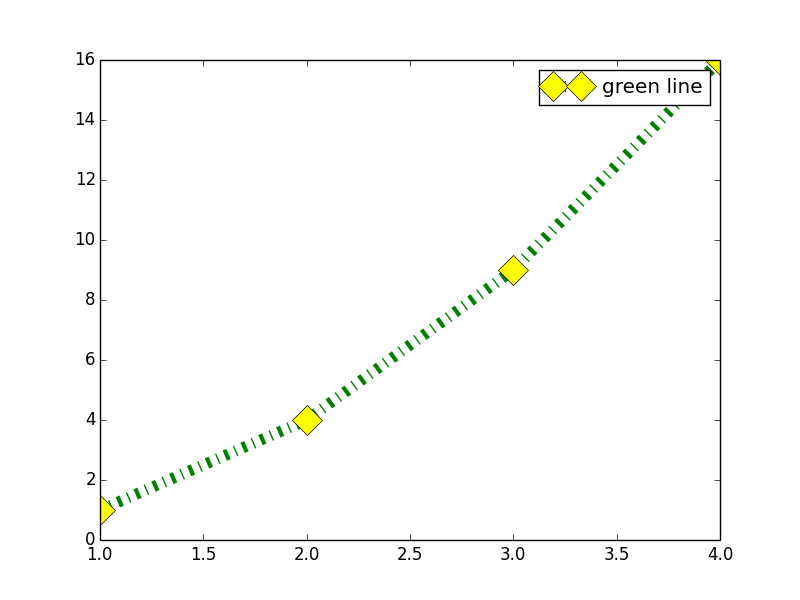
Below a possibly ugly combination of line properties :
# (Image above)
import matplotlib.pyplot as plt
plt.plot([1,2,3,4],[1,4,9,16], 'gD-.', label='green line',\
         linewidth=8, markerfacecolor='yellow', markersize=15)
plt.legend()
plt.show()