/documentations/python_libraries/matplotlib/
Multiple Plots
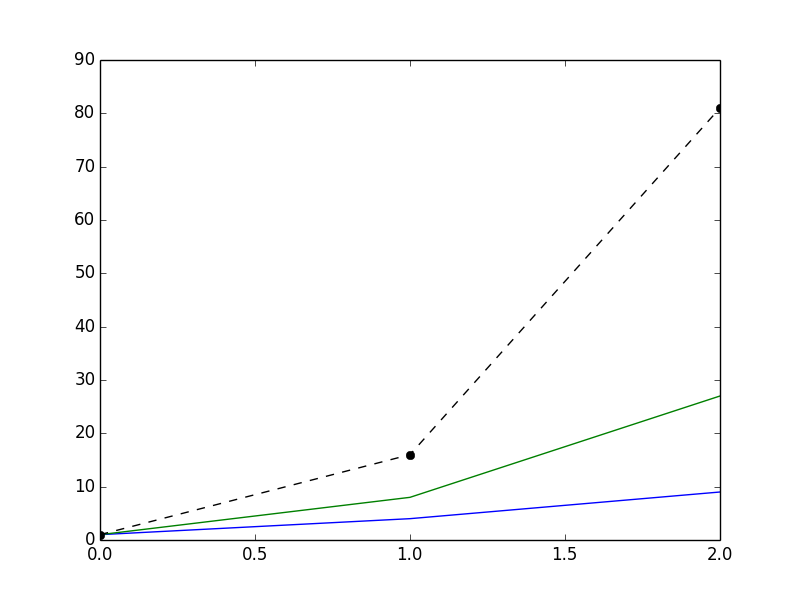
As seen in the last section, plot(x0, y0, x1, y1) plots two lines in the same plotting area. This can also be achieved by stating multiple consecutive plot commands:
# (Image above)
import matplotlib.pyplot as plt
plt.plot([1, 4, 9])
plt.plot([1, 8, 27])
plt.plot([1, 16, 81], 'k--o')
plt.show()