/documentations/python_libraries/matplotlib/
Graph of a Function
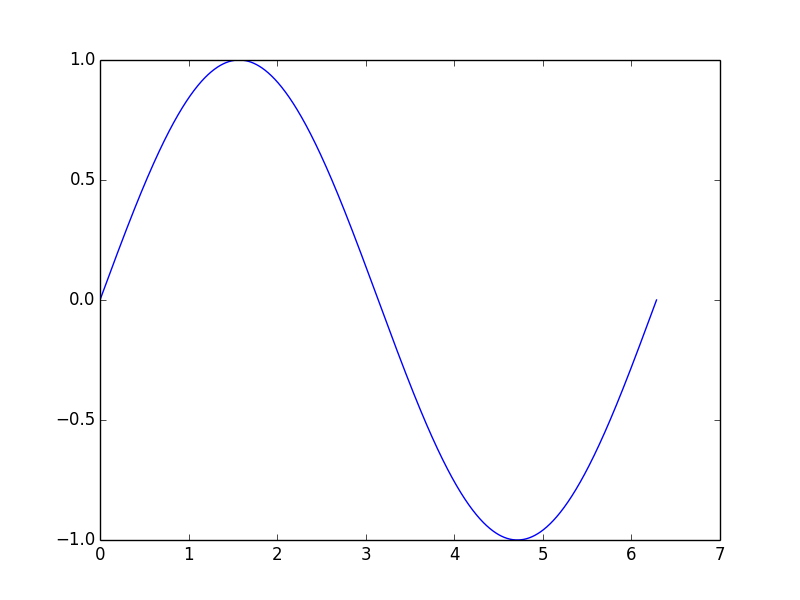
Often one wants to quickly plot the graph of a function or the trace of a curve in the plane. In this case it is good idea to make use of the numpy libray, which implements powerful array manipulation tools:
# Graph of the Sine Function
# (Image above)
import matplotlib.pyplot as plt
import numpy as np
t = np.linspace(0, 2*np.pi,1000)
plt.plot(t, np.sin(t))
plt.show()

# A Lissajous Curve
import matplotlib.pyplot as plt
import numpy as np
t = np.linspace(0, 2*np.pi,1000)
plt.plot(np.sin(2*t), np.cos(3*t))
plt.show()