/documentations/python_libraries/matplotlib/
Multiple Plotting Areas
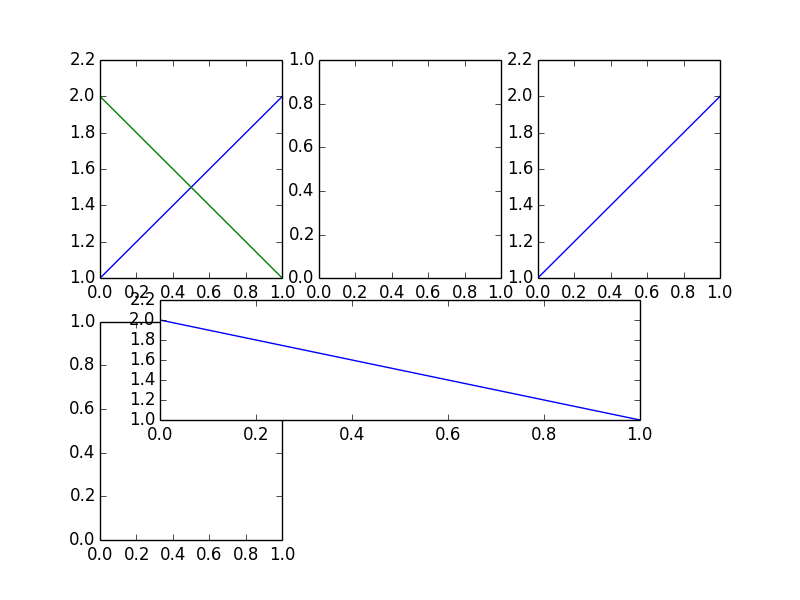
The function subplot (docs) allows to add multiple Axes to one figure. The usage of subplot is: subplot(nrows, ncols, plot_number) to add Axes in a grid (see gridspec for more complicated grids). It is also possible to position an Axes freely: axes([left, bottom, width, height]), where the parameters are in the interval [0, 1] and left and bottom are distances from the left and bottom of the figure:
# (Image above)
import matplotlib.pyplot as plt
plt.subplot(2,3,1)
plt.plot([1,2])
plt.plot([2,1])
plt.subplot(2,3,2)
plt.subplot(2,3,3)
plt.plot([1,2])
plt.subplot(2,3,4)
plt.axes([.2, .3, .6, .2])
plt.plot([2,1])
plt.show()
The plot command always plots to the last added Axes. This principle is also used when decorating or adding other graphic elements to an Axes. Here we can see why pyplot is called "stateful".
It is possible to take control over where plots go, by using the second approach mentioned in the introduction:
import matplotlib.pyplot as plt
ax0 = plt.subplot(2,3,1)
ax1 = plt.axes([.2, .3, .6, .2])
ax0.plot([1,2])
ax0.plot([2,1])
ax1.plot([2,1])
plt.show()