First Example
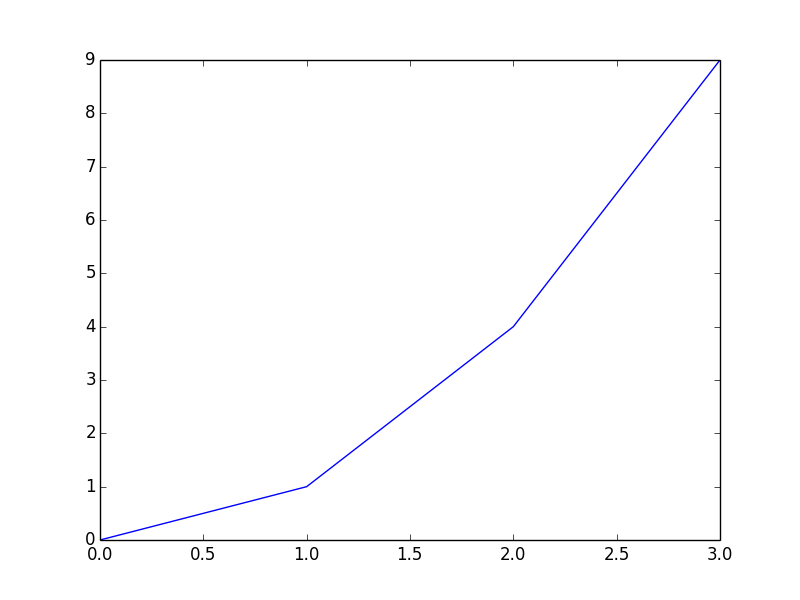
# (Image above)
import matplotlib.pyplot as plt
plt.plot([0, 1, 4, 9])
plt.show()
This first example shows how easy it is to visualize data with Matplotlib. It boils down to: import the library, issue the plot command and ask the library to display the result.
There are two main approaches to plotting with Matplotlib. The first is the way called "stateful", which one may know from Matlab or similar software for scientific calculations. In this approach matplotlib.pyplot generates and keeps track of the various plot objects. The second is the object oriented way, where the user keeps track of the plot objects and accesses them directly. Which one is used depends on the required level of control.
The first example above follows the first approach, relying on the library to do most of the job. The example below keeps track of all the objects and relies on the library just to create them.
import matplotlib.pyplot as plt
fig = plt.figure(1)
ax = fig.add_subplot(1,1,1)
line = ax.plot([0, 1, 4 , 9])
plt.show()
The workflow as seen in this example is:
- import the library
- create a figure
- add a plotting area to the figure
- add some plot to the plotting area
- ask the library to show the result on the screen